

Monitoring & Observability for Networks and Infrastructure
Unified visibility, actionable alerts, and clear reporting. We identify degradations before they become outages and provide you with simple dashboards for quick decisions.
Suitable for
- Multi-site networks (HQ + branches, warehouses, stores)
- Environment with strict SLA (call center, production, logistics)
- Small IT teams that need visibility without the noise
- Organizations that want monthly executive reports, not raw logs
What exactly do you get?
- Alerts that matter (Teams/email) with context and remediation steps
- Grafana dashboards by category: WAN/LAN, Wi-Fi, servers, security
- Executive reports: availability, top incidents, capacity trends
- Runbooks for repeatable incidents (who, what, in what order)
- History for post-incident analysis and capacity planning
6-step methodology
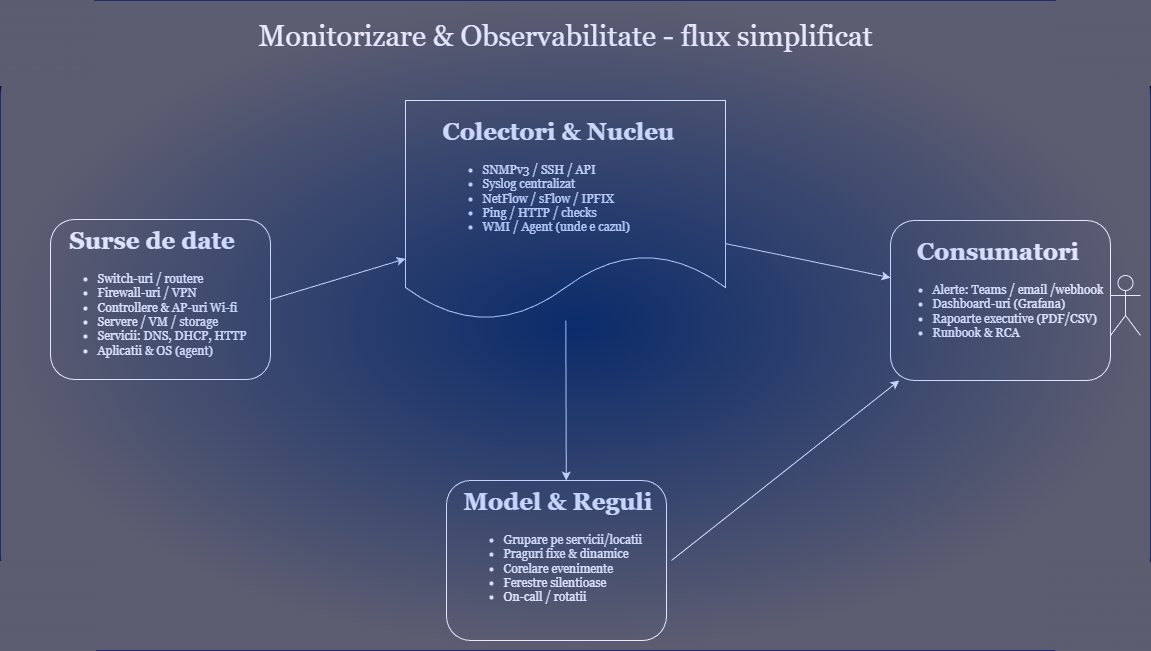
- Inventory: list of equipment, versions, locations, priorities.
- Collection: SNMP/SSH/API, NetFlow/sFlow, syslog, ping/HTTP, WMI/agent where necessary.
- Model & thresholds: we group by services and locations, define fixed/dynamic thresholds and correlations.
- Dashboards: dedicated dashboards (network, Wi-Fi, security, servers), executive overview.
- warning: rules by severity, aggregation, silent windows, on-call.
- Reports & improvement: trends, RCA, quarterly optimizations.
Estimated time & involvement
- Kernel setup: 0.5–1 day (monitoring server, network access, read-only accounts).
- Equipment integration: 1–3 days (SNMP profiles, NetFlow collectors, syslog, agents where applicable).
- Dashboards & alerts: 1–2 days (models, thresholds, Teams/email, load test).
- Reports & runbooks: 0.5–1 day (monthly format, KPI, incident procedures).
requirement: read-only access (SNMPv3, API), NetFlow/sFlow feed, centralized syslog, AD service account (if necessary), IT contact person for each location.
Switches: collection is passive; does not affect traffic. Configurations on devices are done in scheduled windows.
Supported equipment & sources
- Switches/routers, firewalls, Wi-Fi controllers and APs
- Physical/VM servers, hypervisors, storage, critical services (DNS/DHCP)
- Collection: SNMPv3, syslog, NetFlow/sFlow/IPFIX, API/SSH, WMI/agent
- Visualization: Grafana, custom dashboards by roles (IT, management)
- Notification integration: Microsoft Teams, email, webhook
We work with what you have or propose alternatives that fit your budget and requirements.
Example scenarios & recommendations
| Scenario | Challenge | Brief recommendation |
|---|---|---|
| Saturated WAN link | Low speed, high latency | NetFlow + thresholds per usage; QoS and schedule for non-critical traffic; capacity report |
| APs with many clients | Wi-Fi degradation during peak hours | Alert on client/AP number and retry rate; load balancing; channel/power adjustment |
| Unstable VPN tunnel | Intermittency between locations | Tunnel SLA monitoring; ISP event correlation; fallback and gradual alerts |
| Slow application server | Affected users | CPU/memory/disk I/O correlation with latency; dynamic thresholds; scaling runbooks |
| Certificate almost expired | Services could go down | Scheduled scan; 30/14/7 day alert; renewal procedure |
| Overwhelming logs | Noise, lack of meaning | Filtering by severity/source; aggregation rules; alerts only on anomalies |
What we deliver
- Configured and secured monitoring instance
- Dashboards by services/locations + executive overview
- Alerting policies and Teams/email integration
- Runbooks for common incidents
- Monthly report: availability, incidents, recommendations
Case studies and next steps
VIEW delivered projectsFor an estimate, send us your equipment and location list; we'll come back with a clear plan.